With only weeks to go before the Transfer Test, the question is not whether your child is working hard enough. It is whether their practice time is going where the marks are. A progress report answers that by replacing one number with a map: which topics are strong, which are weak, and which specific skills inside a weak topic are costing marks. That turns “do more practice” into one or two clear targets for the week.
The charts in this guide come from a real TransferNI progress report, with the child's name removed.
Why isn't one overall score enough?
Because an average hides the spread. A child can score well overall and still have one area quietly losing them marks, and nothing in a single percentage will tell you which.
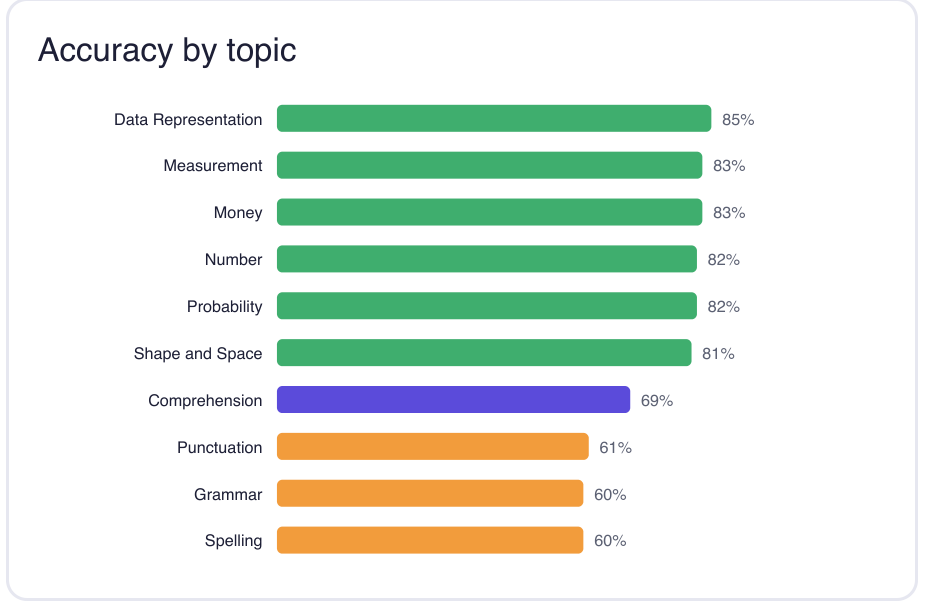
This pupil has answered 1,412 questions and got 78% of them right — a solid figure. But the topic chart splits cleanly in two. Every Maths topic sits between 81% and 85%. Every English topic sits between 60% and 69%. Another month of mixed practice would spread effort evenly across both, when almost all of the easy gains are on one side.
Why focus on the weakest areas first?
Because that is where the easiest marks are. Moving a skill from shaky to solid usually takes far less effort than polishing an already strong one to perfect, so practice aimed at weak spots gives the biggest return for the time spent.
A rough way to picture it: if getting confident in a skill takes 20% of the total effort, going from confident to expert takes another 40%, and from expert to flawless the final 40%. These are not measured figures, but the shape will be familiar to anyone who has learned an instrument or a sport. This pupil's Maths, at over 80%, is already in that expensive final stretch. Their English, at around 60%, is not.
The arithmetic points the same way. English is half of each SEAG paper — 28 of the 56 questions. Lifting English from around 62% to 75% would be worth roughly three or four extra marks a paper; lifting Maths from 83% to 88% would be worth one or two. For similar effort, that is at least twice the return.
How do you find the weak spot inside a weak topic?
Look one level down. A topic like Spelling is several different skills, and they are rarely weak in equal measure, so the useful target is usually a single sub-skill rather than the whole topic.
This pupil's Spelling is at 60% overall, but that hides a lot. Homophones (3 out of 3) and letter order (5 out of 6) are fine, and common exception words are holding up at 14 out of 19. The trouble is concentrated in phonograms — letter groups that make a single sound, such as -igh or -tion — at 2 out of 8, and silent letters at 4 out of 8.
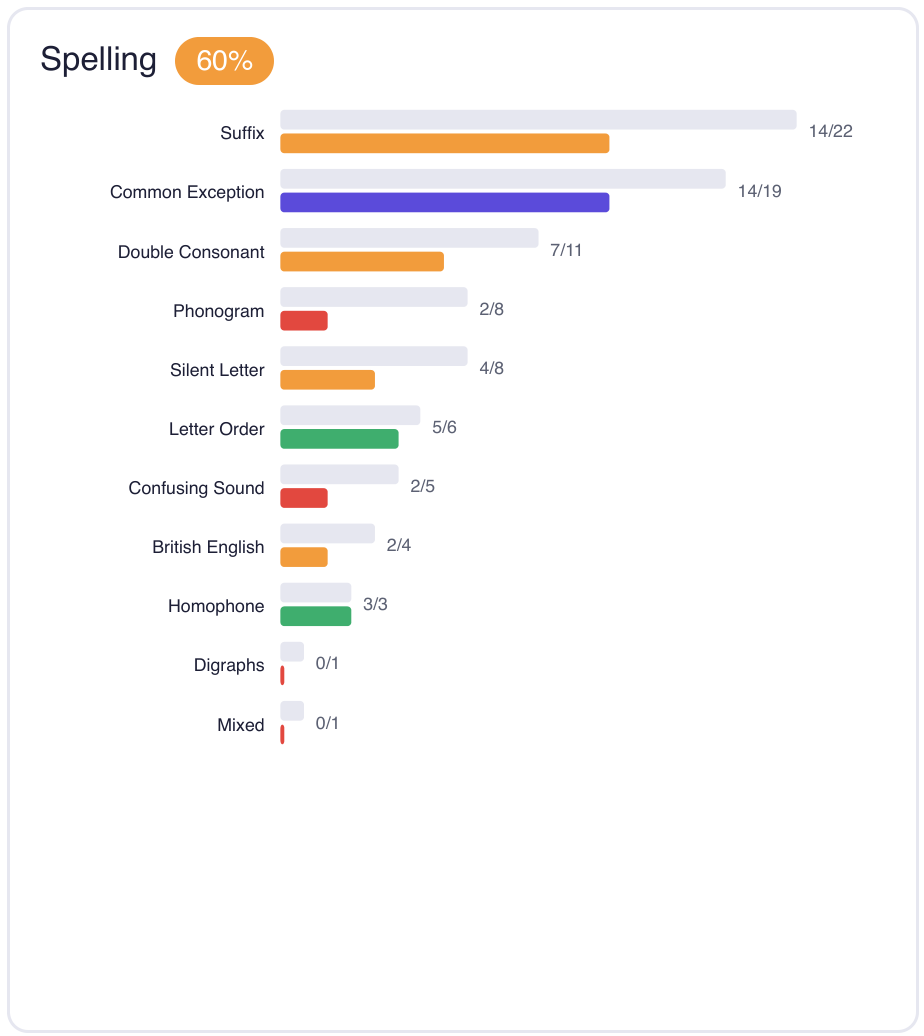
That is a target a ten-year-old can work on this week: not “spelling”, but phonograms and silent letters.
What does a weak spot actually look like?
Usually something small and specific, and often something nobody realised was a problem. A few examples of what a breakdown like this can turn up:
- Spelling: British or American? The same report shows British English spellings at 2 out of 4. That is only four questions, so not conclusive, but worth checking. A child who reads, games or watches a lot of American content can absorb “color”, “center” and “organize” without anyone noticing. In a test set in Northern Ireland, those are misspellings. Once spotted, it is a quick fix.
- Punctuation: the basics. This pupil gets 16 out of 23 apostrophe questions right, but only half of those on capital letters (4 out of 8). Capital letters are a basic skill, which is exactly why fixing them is cheap: it is the bottom of the effort curve.
- Shape and Space: angles. A child can be comfortable with shapes, symmetry and nets and still lose marks on angles, often because one rule has not stuck: angles on a straight line make 180°, angles around a point make 360°, and the angles inside a triangle make 180°.
- Probability: the language of likelihood. Some children can do the arithmetic but mix up the words — thinking “unlikely” means “impossible”, or not knowing where “even chance” sits. That is a concept to understand, not more questions to grind through.
None of these shows up in an overall score. All of them can be fixed in days rather than months, which is exactly the kind of work that pays off when time is short.
How many answers does a result need before you trust it?
More than a handful. A percentage built on one, two or three questions can swing on a single lucky or unlucky answer, so treat a sub-skill with only a few attempts as unknown — not weak, and not strong either.
The Grammar breakdown from the same report shows why. Verb forms (11 out of 17) and conjunctions (9 out of 15) have enough answers to act on. Prepositions, at 1 out of 6, are worth a closer look. But comparatives, modal verbs and question forms each show 1 out of 1: a perfect score that tells you almost nothing.
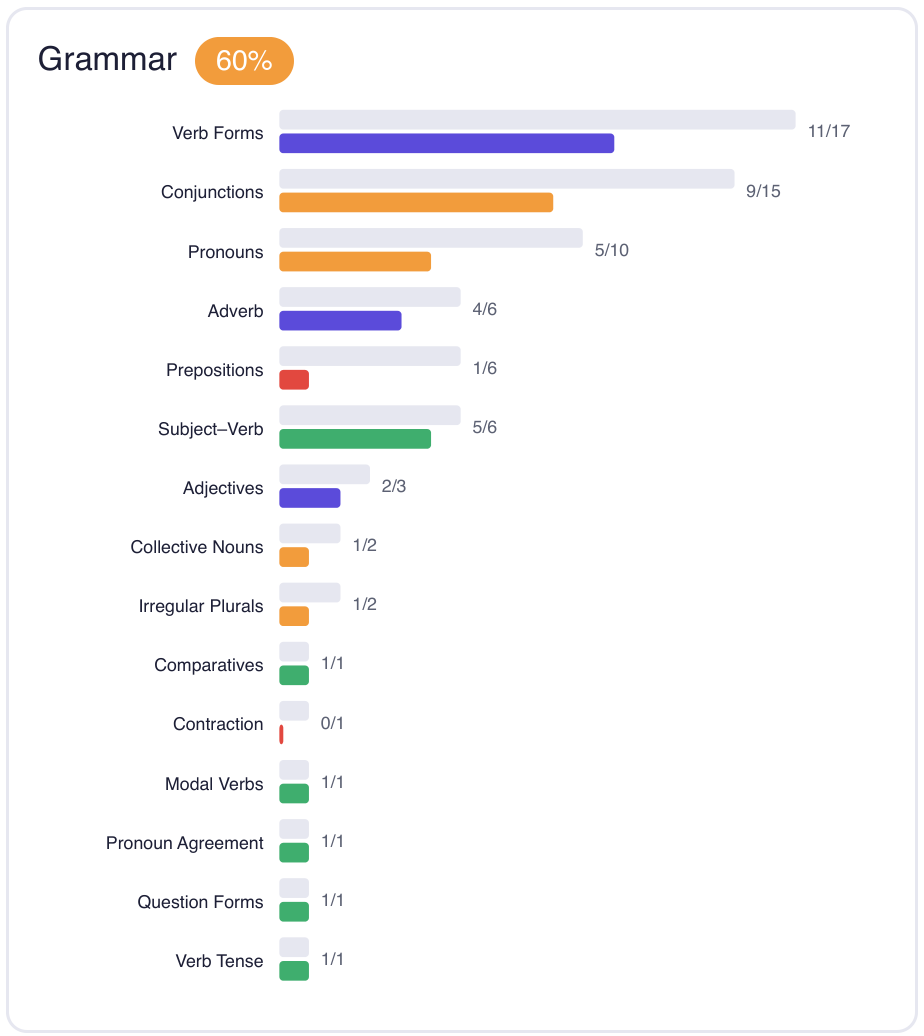
This is why a TransferNI report will not generate until a child has answered at least 60 questions, and charts a topic only once it has at least five answers. For the smaller sub-skills underneath, look for a pattern across several questions before deciding anything. If something has hardly been attempted, the first job is to practise it enough to find out where it stands.
How do you turn the report into a plan your child can follow?
Choose one or two sub-skills, not five, and build short sessions around them. A ten- or eleven-year-old can hold a clear target in mind; a long list just becomes another source of pressure.
- Pick one or two targets — the lowest sub-skills with enough answers to trust. For this pupil, phonograms and capital letters.
- Keep sessions short. Ten to fifteen focused minutes on phonograms will do more than an hour of mixed English.
- Mix in something they are good at — for this pupil, a few Maths questions — so the session does not feel like a list of failures.
- Check again after a week or two. When a target improves, the next lowest becomes the new one.
How should you talk to your child about their report?
Start with what is going well, and describe weak areas as next targets rather than problems. How a report is presented decides whether it helps a child focus or simply makes them anxious.
Show the strongest area first — for this pupil, every Maths topic above 80%, which is worth saying out loud. Then pick the targets together, and if there are two, let your child choose which to start with: owning the choice makes a real difference to how willingly they practise. Praise movement in a sub-skill, not just the total, and avoid comparing their report with a sibling's or a friend's. The report is for working out what to do next, not for ranking anyone.
How do you know it is working?
Look at whether the specific skills you targeted have improved, and at accuracy across many answers rather than a single paper.
Individual mock results can swing widely from one sitting to the next — a paper started on a tired evening, or left unfinished, counts just the same as one sat properly. The steadier signal is accuracy over hundreds of answers, like this pupil's 78% across 1,412 questions, and whether the targeted sub-skills are climbing.
One caution: a practice percentage is not a prediction of the real result, because Transfer Test results are standardised against everyone who sits the assessment. Use the report to decide what to practise, not to guess an outcome. What a standardised score actually means explains why.
To see the full two-page layout a parent receives, look through our sample progress report, which uses invented figures.
Common questions
How often should I look at my child's progress report?
Every week or two is plenty. Looking after every quiz turns normal ups and downs into worry, for you and your child. A report is most useful after a batch of practice, when there are enough answers in each topic for the percentages to mean something. Check it, pick the next one or two targets, then leave it alone until the next look.
Should my child only practise their weakest topics?
No. Most practice time should go on one or two targets, but stronger topics still need a little attention so they stay sharp, and they stop sessions feeling like a list of things your child is bad at. A session that mixes a target with something they enjoy is far easier to start, and far more likely to happen.
My child's overall score dropped but their weak topic improved. Is that a bad sign?
Not usually. One paper can simply be harder than the last, and a single result moves around for reasons that have nothing to do with progress. Look at the trend across several mock tests, and at whether the specific skill you targeted has improved. If it has, the work is paying off, even if the headline number had a quiet week.
Read next
- How to pinpoint where your child is struggling in Maths
- What a standardised score actually means
- Five-minute habits that add up
Dates, scoring and assessment details are set by SEAG and can change — always confirm the current position on the official SEAG website. Our key dates page lists the 2026–27 milestones.